Velocity Banking vs. an Accelerated 30-Year Fixed: What 36 Years of Rate History Says
Kent Kopen, Certified Liability Advisor
·
·
Version 1.0
Abstract
Velocity banking is sold as a structural shortcut to mortgage payoff: route household cash flow through a line of credit, make large principal payments from the line, and let daily-interest mechanics do work a fixed-rate amortization cannot. This paper tests that claim against 36 years of actual rates. A single household ($400,000 mortgage, $10,000 monthly income, $2,000 monthly surplus) is run through every five-year window starting each month from January 1990, 378 windows in all, under identical monthly outlay in every branch. The second-lien chunking strategy, the version marketed to consumers, finished behind an accelerated fixed-rate borrower who refinances at no cost (when rates fall) in 378 of 378 windows, with a median shortfall of $12,232 before program fees and $20,305 after. In other words, it never wins. Decomposition shows the chunking itself is nearly neutral; the shortfall comes almost entirely from the strategy’s instruction to stop refinancing. The first-lien sweep account won 19% of windows before fees and 5.3% after, and every win occurred in a window that began at the onset of a recession, when short rates were collapsing. Those are also the periods in which lenders exercise the contractual right to freeze or reduce home equity lines. The strategy’s only favorable condition and its instrument’s failure condition are the same condition. DebtRetired does not recommend velocity banking and does not use it with clients.
Key findings
Second-lien chunking, as sold, lost every window. 0 wins in 378. Median shortfall $12,232 (mean $13,346); $20,305 with the typical $5,997 program fee. Zero wins at 48 and 84 months as well.
The loss is the advice, not the mechanics. Allow the chunking household to refinance and the shortfall collapses to $769. The “stop refinancing” instruction costs almost exactly what the refinance option earns: a median $11,685 per five-year window.
The first-lien sweep won 19% of windows before fees, 5.3% after. Every win began at the onset of a recession, when short rates were collapsing. Best win $15,810; worst loss $76,552.
Its best five years become its worst under a rate path within living memory. Replay the August 2008 window on the 1978–82 path and the $15,810 win becomes a $64,160 loss.
The 2021 buyer finished $75,077 behind on identical cash. The product was marketed hardest when adopting it cost the most.
The win condition is the freeze condition. The downturns that make the sweep win on rate are the downturns in which lenders are contractually permitted, and historically inclined, to freeze the line that carries the strategy.
1. The question
Velocity banking programs make a specific, testable claim: that moving a household’s mortgage payoff through a line of credit produces a faster payoff than sending the same dollars to a fixed-rate mortgage. The claim is usually demonstrated with a side-by-side simulation in which the velocity household finishes in seven to ten years and the conventional household takes thirty.
The demonstrations I have reviewed share a design flaw. The velocity household commits its entire monthly surplus to debt reduction; the conventional household commits nothing beyond the required payment. The comparison therefore tests whether paying more retires debt faster, which nobody disputes, rather than whether the structure adds anything once cash flow is held equal.
So the question this paper asks is the one the demonstrations skip. Holding monthly outlay identical across strategies, and using the rates that actually prevailed, was there any four-, five-, or seven-year period since 1990 in which velocity banking beat a borrower who simply paid extra on a 30-year fixed and refinanced at no cost when rates fell? If so, how often, under what conditions, and by how much, in both directions?
2. What was tested
2.1 The household
One persona anchors the core scan: a $400,000 30-year mortgage, $10,000 of monthly income, and $2,000 of monthly surplus above the required principal-and-interest payment. This matches the sample scenario used in DebtRetired’s own planning work and sits inside the free-cash-flow range of the households the practice serves. A second, high-intensity persona ($100,000 balance, $3,000 monthly surplus), the kind of case sweep-product demonstrations favor, is run separately in Section 4.6.
2.2 Equal outlay
Every strategy deploys exactly the same cash every month: the starting required payment plus the $2,000 surplus. This is the control the marketing demonstrations omit, and it is the whole test. If a structure cannot beat its alternative on equal dollars, the structure is not the source of the result.
2.3 The four branches
A0, fixed with no refinancing. 30-year fixed at the Freddie Mac PMMS survey rate plus 25 basis points, the premium at which a no-cost refinance (lender rebate covering all closing costs) has been consistently available in my own lending practice. Pays required payment plus surplus every month; never refinances. Exists to measure the value of refinancing; not the comparator.
A, fixed with serial no-cost refinancing. The comparator. As A0, except the borrower refinances at no cost whenever a lower rate would cut the required payment by at least $100 per month, subject to a six-month early-payoff window and a $250,000 minimum balance (below which a 25-basis-point rebate cannot cover closing costs). Total outlay stays constant after each refinance, so savings flow to principal. This is what I would tell a client to do, and it is the standard any alternative has to beat.
V1, first-lien sweep account. The mortgage becomes an open-ended first-lien line of credit. Paychecks deposit against the balance twice a month; expenses draw back out; interest accrues daily on the net balance. Rate: Fed Funds plus 3.75, floor 3.75, lifetime cap six points above the initial rate, per the published terms of the leading product in this category. $3,500 closing cost financed; $60 annual fee. Semi-monthly float modeled explicitly.
V2, second-lien chunking. The version taught in most consumer webinars. Fixed mortgage stays at its starting rate; a home equity line at Prime plus 1 (18% cap) is opened. Each time the line is clear, a $10,000 chunk is drawn and applied to mortgage principal; surplus and any freed mortgage payment then attack the line. No sweep of expenses; $75 annual fee. As taught, the mortgage is never refinanced.
As-sold sensitivity. Both velocity branches also run with a $5,997 program fee financed on day one, the published low-tier price of a widely marketed program.
2.4 Windows, horizons, materiality
Every monthly start from January 1990 through the latest start that completes before the data ends (June 2026), at horizons of 48, 60, and 84 months. The 60-month horizon yields 378 windows and is the headline. A velocity branch “wins” a window if it finishes more than $1,000 ahead (25 basis points of the starting balance); within $1,000 is a tie. The metric is net position at the horizon: total remaining debt less any side cash accumulated after payoff, under identical cumulative outflow. Lower ending debt is higher net worth.
2.5 Data
Three FRED series: MORTGAGE30US (first weekly observation each month), MPRIME, and FEDFUNDS, transcribed and validated for month continuity. Fed Funds proxies 30-day SOFR for the sweep index, which matches the sweep product’s own published methodology. All runs are pre-tax.

Figure 2. What each strategy paid, 1990 to 2026: the no-cost 30-year fixed (PMMS plus 0.25), the first-lien sweep rate (Fed Funds plus 3.75, floor 3.75), and the second-lien line (prime plus 1).
3. How to read the exhibits
Figure 1 plots, for every monthly start, how far behind (or ahead) each velocity strategy finished at month 60 relative to the comparator. Above zero, velocity lost; below zero, it won. Figure 2 shows the three instrument rates the strategies actually paid. Figure 3 traces the single best window velocity ever had and replays it on a historical stress path. Figure 4 repeats Figure 1 with NBER recessions shaded and the 2008 HELOC freeze wave marked. Figure 5 traces the 2021 cohort. The audit workbook maps every exhibit to its source rows.
4. Findings
4.1 Second-lien chunking never won
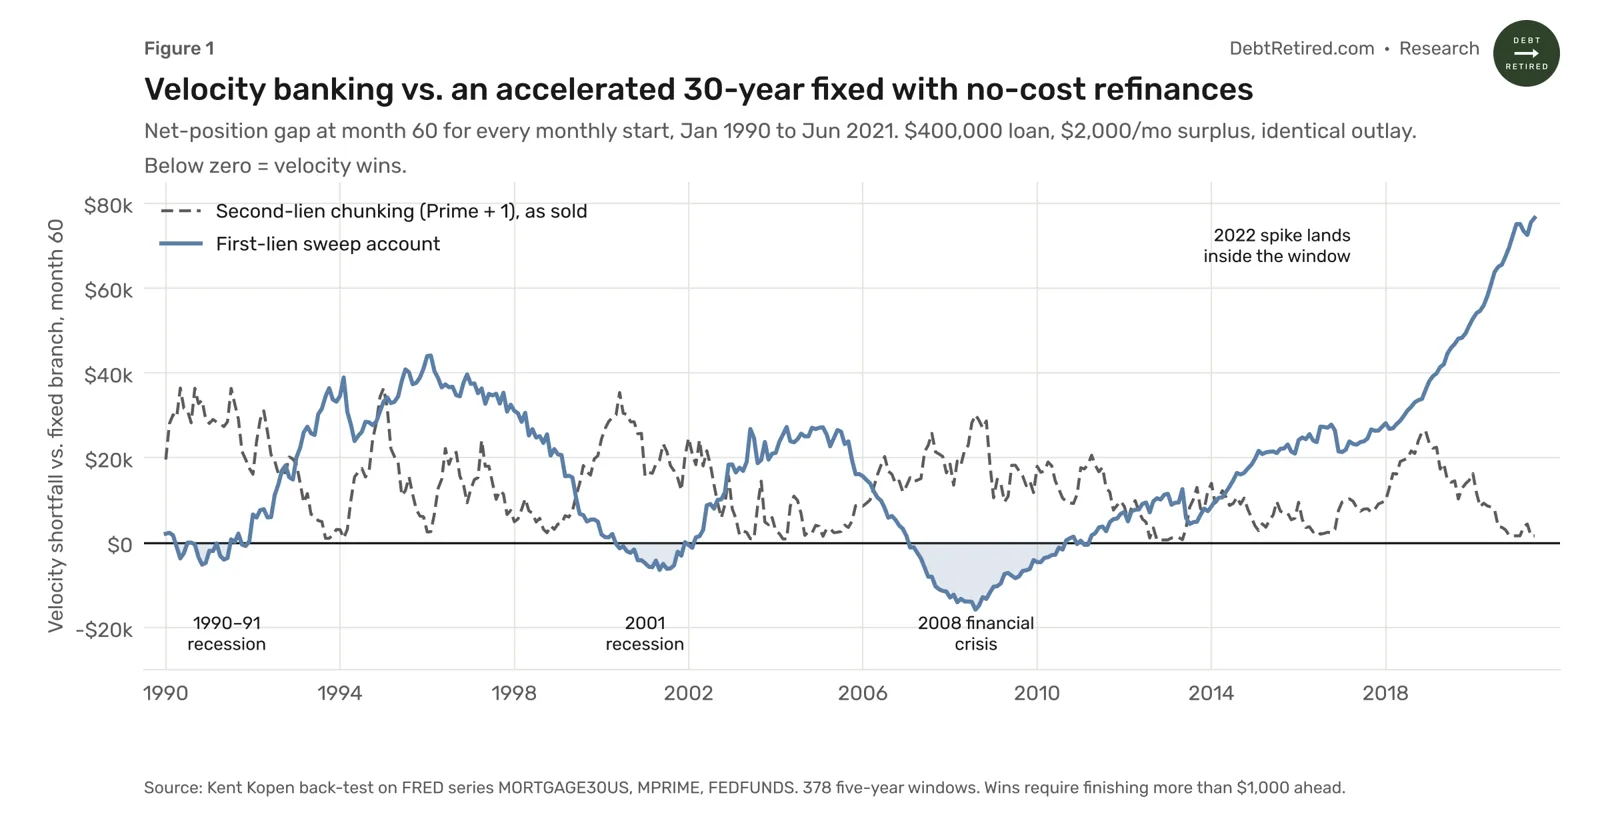
Figure 1. Net-position gap at month 60 for every monthly start, 1990 to 2021. Below zero, velocity wins.
Across 378 five-year windows, the second-lien strategy finished behind the comparator every time.
Wins: 0 of 378. Also 0 at 48 months and 0 at 84 months.
Median shortfall $12,232; mean $13,346.
Worst window: $36,438 behind (start May 1990). Best: a $614 shortfall, a tie.
With the $5,997 program fee: median $20,305, mean $21,601.
4.2 The shortfall is the forgone refinances, not the chunks
To isolate what the chunking itself does, I re-ran the second-lien strategy with one change: the mortgage leg was allowed to refinance on the same rule as the comparator. The median result moved to a $769 shortfall, with three marginal wins in 378 windows. Chunking per se is nearly a no-op; it moves a few hundred dollars over five years. Almost the entire $12,232 is the cost of the instruction that travels with the strategy, “stop refinancing, lenders profit from it.”
The comparator’s refinance option, measured as A minus A0, produced a median gain of $11,685 per five-year window (maximum $36,758, start May 1990), with a median of four refinances per window. That figure and the chunking shortfall are, to within rounding, the same money. The structure received the credit; the forgone behavior paid the bill. This is the causality principle that organizes all of DebtRetired’s work, visible in the data: accelerated payoff is a function of cash flow and sequencing, not account mechanics.
4.3 The first-lien sweep won sometimes, and only at the onset of a rate collapse
Wins: 72 of 378 (19%) before fees; 20 of 378 (5.3%) after the program fee.
100% of wins occurred where the sweep index sat below the achievable no-cost fixed rate for most of the window, and where the 30-year rate fell materially during the window (mean change in winning windows: minus 1.6 points).
Win-start dates cluster in three episodes (the shaded troughs in Figure 1): 1990–91, 2000–02, 2007–10.
Best win $15,810 (start August 2008). Worst loss $76,552. The median losing window lost far more than the median winning window gained.
A borrower choosing the sweep was accepting a downside roughly five times the upside, and could capture the upside only by entering the structure shortly before a rate collapse that had not yet happened.
4.4 The stress test

Figure 3. Velocity’s best window (August 2008 start) and the same window on the 1978–82 rate path.
Figure 3 takes the sweep’s finest hour, the August 2008 start, and replays the identical window with rate changes following the actual path from January 1978, when Prime rose from 9% to 21.5%, anchored to 2008 starting levels.
The $15,810 win becomes a $64,160 loss.
The fixed borrower’s worst case under the same path is keeping the rate already locked.
The six-point lifetime cap binds and shields the sweep borrower from the full peak; without it the spliced rate would have touched roughly 18%. The loss is what it is with that protection.
The brief kink around months 28 to 32 is the March 1980 credit-controls episode in the source data: Fed Funds fell from 12.9% to 6.3% in a month and the sweep rate dropped off its cap for five months. The counterfactual grants the sweep every reprieve the record contains.
The second-lien strategy’s stress exposure is small (about $2,000) for an unflattering reason: the chunk balance is never large enough to be dangerous because it is never large enough to matter.
4.5 The 2021 cohort

Figure 5. The 2021 buyer: a 2.90% fixed loan against a sweep account tied to the Fed.
A borrower who started in January 2021 locked a 2.90% no-cost fixed and never had reason to refinance. The sweep borrower started at the 3.75% floor and rode Fed Funds plus 3.75 into the 2022 tightening, paying above 9% at the peak and 7.47% at month 60. On identical cash, the sweep finished $75,077 behind. The product was being marketed most aggressively in exactly the period when adopting it was most costly.
4.6 The high-intensity persona
With a $100,000 balance and $3,000 of monthly surplus, every strategy retires the debt in 30 to 33 months in every era tested. When cash-flow intensity overwhelms the balance, structure is decoration. The drama in a sweep-product demonstration lives in its unequal control, not its mechanism.
5. The conditions under which velocity outperformed
Looking backward, the first-lien sweep beat the comparator if and only if:
the short-rate index sat below the borrower’s achievable no-cost fixed rate for most of the window, and
rates fell materially during the window, and
no spike occurred inside the window, and
the lender left the line open through the downturn that produced conditions 1 and 2.
Conditions 1 through 3 describe three episodes in 36 years and are identifiable only in hindsight. Condition 4 is outside the borrower’s control, and Section 6 explains why it is least likely to hold at exactly the moments conditions 1 through 3 do.
The client-facing version: for this to win, you must forecast a rate collapse before it happens; if you are wrong, the downside is four to five times the upside, and it is entirely your problem.
6. The freeze clause
The back-test excludes one risk by construction, and it cuts against velocity. Both velocity structures are home equity lines of credit. The second-lien version is one by definition; the first-lien sweep is a first-lien HELOC in substance and, in the leading product, in form. A HELOC is revocable credit.
6.1 The contractual right
Regulation Z permits a creditor to prohibit additional extensions of credit or reduce the credit limit on a home equity plan during any period in which the value of the dwelling securing the plan declines significantly below its appraised value for purposes of the plan, or in which the creditor reasonably believes the consumer will be unable to fulfill the repayment obligations because of a material change in the consumer’s financial circumstances (12 CFR 1026.40(f)(3)(vi); codified at 12 CFR 226.5b(f)(3)(vi) in 2008). The Official Interpretations supply the working definition lenders used: a decline of 50 percent or more in the difference between the credit limit and the available equity at origination is a significant decline (Official Interpretations to section 1026.40(f)(3)(vi)). No delinquency is required. No appraisal is required.
6.2 How it was exercised
In 2008 the trigger was pulled at portfolio scale, by automated valuation models, in every market where prices were falling. The record:
January 2008. Countrywide sent suspension letters to some 122,000 home equity borrowers (Kiplinger, June 30, 2008). A Countrywide memo that month set the candidate test as untapped equity falling 50 percent below its opening level (Washington Times, Feb. 29, 2008).
By May 2008. Countrywide, Bank of America, Washington Mutual, and IndyMac had frozen an estimated 600,000 lines nationwide, per Michael Kratzer of Bankrate’s feedisclosure.com (Bloomberg, “Countrywide Takes Away Home-Equity Credit Lines in Las Vegas,” May 2008; LA Times, May 6, 2008).
March 2008 onward. Chase began reducing or freezing existing lines nationwide; more than 150,000 Chase customers saw changes, less than 20 percent of its home equity book, with home values reviewed monthly (Detroit Free Press/McClatchy, Sept. 15, 2008).
September 2008 to September 2009. Open HELOC accounts fell by about 855,000 to 13.65 million; roughly $68 billion of available credit was removed; average limits fell from about $105,000 to $79,000 over two years (Equifax, via HousingWire, Dec. 23, 2009).
The litigation. In re JPMorgan Chase Bank Home Equity Line of Credit Litigation, No. 10-cv-3647, MDL 2167 (N.D. Ill.), certified a class of all Chase customers whose lines were suspended or reduced on value-decline grounds between January 1, 2007 and September 30, 2012. In the 2012 settlement, Chase agreed for one year to stop relying on three tiers of its automated valuation models, to limit its use of a 5 percent value-decline criterion to high combined loan-to-value accounts, and to refund appraisal fees to customers who appealed successfully. Chase denied the allegations.
Most of the affected borrowers were current on their payments. I received two of those letters, one for each house I owned at the time. A client of mine, a small-business owner, had a line I arranged years earlier as a rainy-day backstop. She intended to make payroll from it in 2008. It was frozen. She nearly lost the business.
6.3 The win condition is the freeze condition

Figure 4. Figure 1 with NBER recessions shaded and the January to May 2008 HELOC freeze wave marked.
Return to the three episodes in which the sweep won: 1990 to 1991, 2000 to 2002, and 2007 to 2010. Each sits at the onset of an NBER recession (Figure 4). Short rates collapsed in those windows because the Federal Reserve was responding to a downturn, and downturns are what fire the two freeze triggers in the contract: falling home values and deteriorating borrower circumstances. The 2008 episode fired both nationally. The 1990 to 1991 episode fired the value trigger regionally (New England, California, Texas) and the circumstances trigger broadly. The 2001 episode did not produce a national decline in home prices, but unemployment rose and lenders tightened; the circumstances trigger was live. The pattern held out of sample in 2020: rates collapsed, and Chase and Wells Fargo stopped accepting new home equity applications that spring even as home prices were rising (press reports, April–May 2020).
The implication is structural, not statistical. The only condition under which the sweep strategy outperforms is a condition in which the instrument carrying the strategy is most likely to be frozen. A borrower with perfect foresight of the rate drop would also foresee the freeze letters and would choose the fixed loan. For a household running a sweep, a freeze does not merely remove a backup: the paycheck still deposits against the balance, the draw feature that returns spending money is closed, and the family’s liquidity converts into involuntary principal payments at the moment the economy is contracting.
6.4 Fairness points
Three qualifications, stated before a critic states them:
The value trigger did not fire everywhere in every episode; 2001 is the clear case.
A first-lien sweep at a low loan-to-value ratio has more cushion against the value trigger than a second-lien HELOC stacked behind a mortgage. The circumstances trigger applies to both.
This paper makes no claim about whether any specific sweep product froze draws in 2008. It states the contractual right every such product carries and the industry’s documented record of exercising it.
6.5 What it means for the discipline
Liability management treats liquidity as a first-class asset and distinguishes owned liquidity from borrowed access. A HELOC is the second kind. It is appropriate as standby credit when evaluated case by case, with the understanding that it can be withdrawn without notice and without delinquency, and it is never counted as liquidity in a client’s plan. A payoff strategy that routes the household’s entire cash flow through revocable credit has inverted that principle. For completeness: the one home equity line in the U.S. market that cannot be frozen or reduced for a decline in home value is the FHA-insured HECM line of credit, and that guarantee is what its upfront mortgage insurance premium purchases.
7. What velocity’s defenders can rightly say
The sweep’s wins were real, not artifacts. Instant, automatic transmission of falling short rates beats a refinance ladder that steps down with a lag and a $100-per-month trigger. In a 2008-style window the sweep genuinely finished about $16,000 ahead over five years.
The float is real. For this household at typical rates, sweeping deposits is worth $15 to $30 per month, dwarfed by the margin premium but not zero.
These runs exclude behavior. If a borrower would not send the surplus to debt without the structure’s forced discipline, the comparison changes. That is an argument about the borrower, not the instrument, and it prices a $5,997 commitment device. Less expensive commitment devices exist.
Nothing here asserts bad faith. The claim is that the strategy fails on its own terms, with its own assumptions, against the alternative it is sold to replace.
8. Limitations
Overlapping windows are descriptive counts, not independent samples. Since 1990 there have been roughly five distinct rate regimes, so “378 windows” measures the consistency of a result across start dates, not statistical power. No forward probabilities are claimed; conditions are reported instead.
Freeze risk is excluded from the simulations and treated qualitatively in Section 6. Including it would move every result against velocity.
SOFR is proxied by Fed Funds. All results are pre-tax. Income and expense timing conventions follow the Mortgage Payoff Causality Tool.
The no-cost refinance assumption (PMMS plus 25 basis points, rebate covering all costs) reflects my own practice across several hundred loans. A borrower without access to no-cost pricing would see a smaller refinance gain and a correspondingly smaller second-lien shortfall, though not a reversal, since chunking itself is neutral.
9. Method and provenance
The engine is a Python rolling-window simulator (‘engine.py’) with a companion analysis script (‘deepdive.py’) and a chart script (‘charts.py’), all in the reproducibility bundle with the two rate files and the scan output. The audit workbook carries every locked assumption with its source, the rate data with derived instrument rates as live formulas, one row per window and horizon, summary statistics as live formulas over the scan sheets, and the month-by-month traces behind Figures 3 and 5. Simulation paths cannot be expressed as single spreadsheet formulas; any auditor can re-run the scripts against the rate files and regenerate every number. The engine was re-run on October 30, 2026 and reproduced the July 17, 2026 scan to the dollar. Vendor and program names are omitted throughout by design.
10. Conclusion
For velocity banking as it is actually sold, second lien, chunks, program fee, and the instruction not to refinance, the result has no asterisk: zero wins in 36 years of windows at any horizon, and the losses are the price of the advice, not the mechanics. For the first-lien sweep the honest answer is stronger than “never.” It wins only when the borrower successfully times a rate collapse; the average win is a fraction of the average loss; its best five years in history become its worst under a rate path every prospective client’s parents lived through; and the one scenario in which it wins is the scenario in which the contract permits the lender to take the instrument away. That is not a product with a narrow use case. It is a product whose use case and failure case coincide.
Faster payoff comes from cash flow applied to the right balances in the right order and from exercising a free refinance option when the market offers it. The plan fits on a napkin. It beat the five-spreadsheet system in every window there was.
DebtRetired does not sell velocity banking or use it with clients. Advisors who want to discuss a client’s situation, or the standby-credit question specifically, can reach Kent Kopen through the contact page.
References
Federal Reserve Bank of St. Louis, FRED: MORTGAGE30US (Freddie Mac PMMS, 30-year fixed), MPRIME (bank prime loan rate), FEDFUNDS (effective federal funds rate).
Regulation Z, 12 CFR 1026.40(f)(3)(vi), and Official Interpretations to 1026.40(f)(3)(vi). In 2008: 12 CFR 226.5b(f)(3)(vi). See also Federal Reserve, Consumer Compliance Outlook, “HELOCs: Consumer Compliance Implications,” Third Quarter 2008.
National Bureau of Economic Research, U.S. Business Cycle Expansions and Contractions (recessions of 1990–91, 2001, 2007–09, 2020).
Patricia Mertz Esswein, “The Home-Equity Door Slams Shut,” Kiplinger’s, June 30, 2008 (Countrywide, 122,000 letters).
“Banks in crisis cut lines of credit,” Washington Times, Feb. 29, 2008 (Countrywide suspension memo; brokers’ estimates).
Vivien Lou Chen, “Countrywide Takes Away Home-Equity Credit Lines in Las Vegas,” Bloomberg, May 2008; summarized in Los Angeles Times, “Squeeze: Countrywide freezes Vegas HELOCs,” May 6, 2008 (Kratzer estimate, ~600,000 lines).
Susan Tompor, “Lenders pull back on home equity lines,” Detroit Free Press / McClatchy, Sept. 15, 2008 (Chase, more than 150,000 customers; less than 20 percent).
Austin Kilgore, “Equifax: HELOC Origination Down 36%,” HousingWire, Dec. 23, 2009 (13.65 million open accounts; down 855,000; $68 billion; average limits $105,000 to $79,000).
In re JPMorgan Chase Bank Home Equity Line of Credit Litigation, No. 10-cv-3647, MDL 2167 (N.D. Ill.), settlement notice and terms, 2012–13.
Press reports on JPMorgan Chase (April 2020) and Wells Fargo (May 2020) suspending new home equity line applications.
Published product terms for a first-lien sweep account (margin, floor, cap, fees) and published pricing of a second-lien velocity program (low tier), on file; names omitted by design.
Kopen, K. Mortgage Payoff Causality Tool (2026), DebtRetired.com.
Revision history
v1.0, October 30, 2026. First public version. Supersedes the internal memo of July 17, 2026. Adds Section 6 (freeze clause), condition 4, Figures 4 and 5; figures regenerated with brand exhibit frame; vendor references removed from all companion files.
Kent Kopen works alongside advisors, accountants, and attorneys on the liability side of their clients’ balance sheets. Questions about a client’s situation, or about standby credit specifically, are welcome.